
If something about your system does not feel right, have it properly checked.
A slow report, repeated outage, unusual delay, or unexplained performance problem should not become normal simply because nobody has found the cause yet.
In this environment, operational reports were taking around two hours to generate.
Staff had built their working day around that delay. They would start a report, move to another task, and return later hoping it had finished. Nobody was asking why it took so long anymore.
The application was old. The reports were slow. That was simply accepted as the nature of the system.
But "the application is just old" has never been a good enough technical explanation for me.
Starting With the Obvious Suspect
The first thing I checked was the server storage.
The application was running on an aging SAS storage array, so storage performance was an obvious concern. It would have been easy to stop the investigation there, recommend faster storage, migrate the system, and call the problem solved.
The disks were a problem.
They were not the problem.
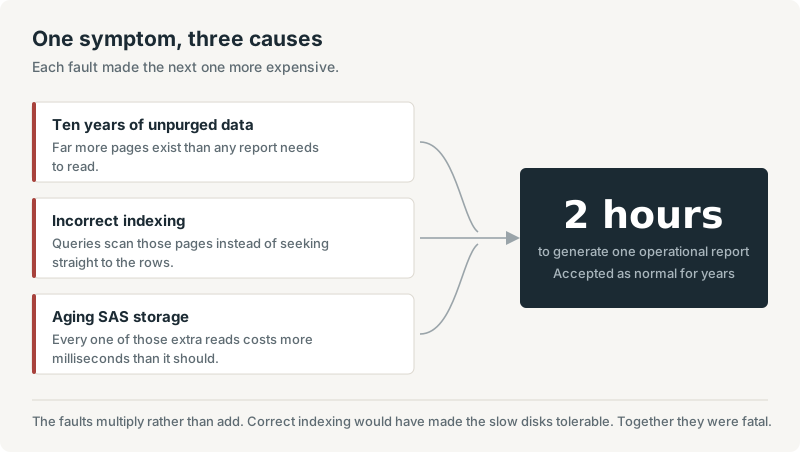
What I found was three separate performance issues stacked on top of each other.
More Than Ten Years of Live Data
The database had not been purged once in over five years.
It was still carrying live operational data going back more than ten years. Most of that historical data was no longer required for daily reporting, and nobody could remember the last time it had been queried.
Keeping historical information can be necessary for compliance, auditing, or business analysis. But that does not mean every record must remain inside the live production database forever.
Without a proper retention and archival policy, the database had continued growing. Every report had more data to inspect, more pages to read, and more unnecessary work to perform.
The application was not simply old. It was carrying years of unmanaged history.
Incorrect Database Indexing
The second issue was the indexing.
The required indexes were either incorrectly configured or no longer suitable for the way the reports queried the database. Instead of quickly locating the required records, the database was scanning far more data than necessary.
This is where performance problems are often misunderstood.
A report may look slow because of the application interface, but the real delay can be happening underneath it. If the database must repeatedly scan large tables, faster processors or disks may reduce the waiting time without fixing the inefficient query path.
The system needed proper indexing and a maintenance plan to keep those indexes and statistics healthy.
Aging Storage
The third issue was the storage itself.
The workload was running on an aging SAS storage array that could no longer provide the performance expected from the reporting system. Once the oversized database and inefficient query patterns were considered, the storage limitations became even more visible.
But replacing the storage alone would not have solved the full problem.
Replacing the storage alone might have cut the report time by half. That would have looked like a successful upgrade, and it would have been the end of the investigation. The new figure would have become the accepted normal, and the decade of unpurged history and the incorrect indexing would still be in that database today.
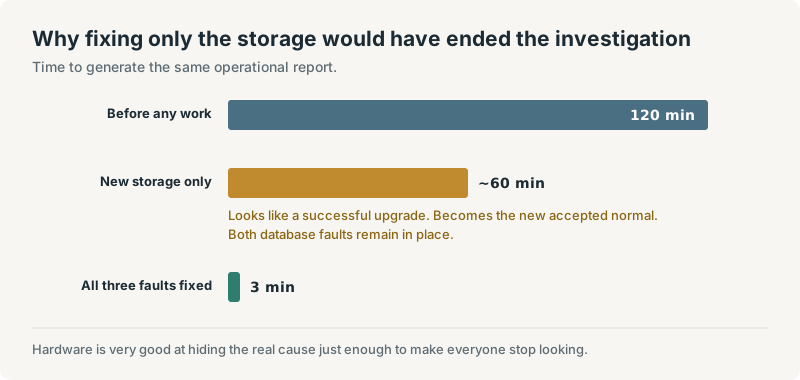
The deeper database issues would have remained.
Fixing the Complete Performance Chain
We addressed the problems in the order that reduced unnecessary work first:
- Introduced a proper data retention and archival policy, which shrank the live database significantly
- Rebuilt and corrected the database indexes, and updated statistics
- Created a maintenance plan to prevent the same degradation from returning
- Migrated the system to faster storage, sized against the reduced working set rather than a decade of history
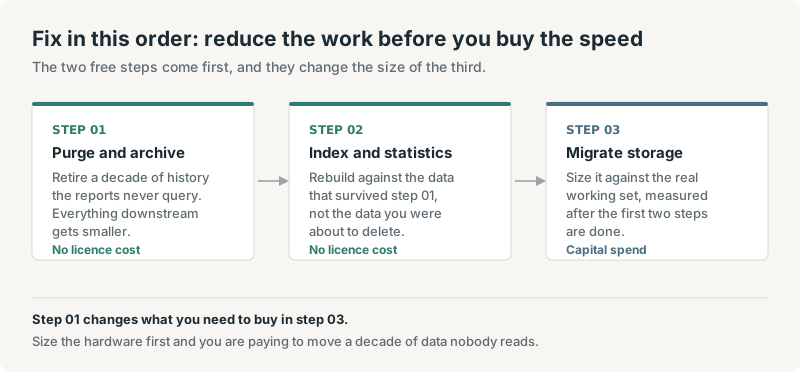
That order matters more than it appears. The first two steps required no new hardware, and they changed the specification of the storage we eventually needed. Size the hardware before purging and you are paying to move a decade of data nobody reads.
Before removing historical records, the data requirements were reviewed and the necessary information was protected according to the agreed retention policy. Performance improvement should never come at the cost of losing data the business is required to keep.
After the work was completed, the same operational reports that previously required around two hours were finishing in approximately three minutes.
That was not a small tuning improvement. It changed how staff interacted with the system.
Reports no longer had to be started hours in advance. Employees no longer planned their work around waiting for results. The application became useful again without replacing the entire platform.
How to Check This in Your Own Environment
These read-only SQL Server checks provide a useful starting point. Run them during a representative workload and compare results over time. Most of these statistics are cumulative, so a single snapshot without workload context can be misleading.
1. Rank Total Waits Before Assuming Anything
Do not start by looking for the problem you expect. Ask the engine what it spends its time waiting on, then read the top of the list.
SELECT TOP (15)
    wait_type,
    waiting_tasks_count,
    wait_time_ms,
    CAST(
        wait_time_ms * 1.0 /
        NULLIF(waiting_tasks_count, 0)
        AS decimal(12,2)
    ) AS avg_wait_ms
FROM sys.dm_os_wait_stats
WHERE waiting_tasks_count > 0
  AND wait_type NOT IN (
      'CLR_AUTO_EVENT', 'CLR_MANUAL_EVENT', 'LAZYWRITER_SLEEP',
      'REQUEST_FOR_DEADLOCK_SEARCH', 'SLEEP_TASK', 'SQLTRACE_BUFFER_FLUSH',
      'WAITFOR', 'XE_DISPATCHER_WAIT', 'XE_TIMER_EVENT',
      'BROKER_TASK_STOP', 'BROKER_TO_FLUSH', 'DIRTY_PAGE_POLL',
      'HADR_FILESTREAM_IOMGR_IOCOMPLETION', 'SP_SERVER_DIAGNOSTICS_SLEEP',
      'FT_IFTS_SCHEDULER_IDLE_WAIT', 'DBMIRROR_DBM_EVENT'
  )
ORDER BY wait_time_ms DESC;
The excluded wait types are idle and background waits that accumulate large totals without indicating a problem. Microsoft's own diagnostic scripts filter a similar list.
How to read the result:
PAGEIOLATCH_*means SQL Server is waiting for data pages to be read from storage. Slow storage, excessive physical reads, or memory pressure can all contribute.WRITELOGmeans SQL Server is waiting for transaction log flushes. Investigate storage latency, log throughput, and transaction patterns.CXPACKETcan indicate parallel-query coordination or workload imbalance.SOS_SCHEDULER_YIELDoften points toward CPU pressure or inefficient queries. Neither automatically means storage is the problem.
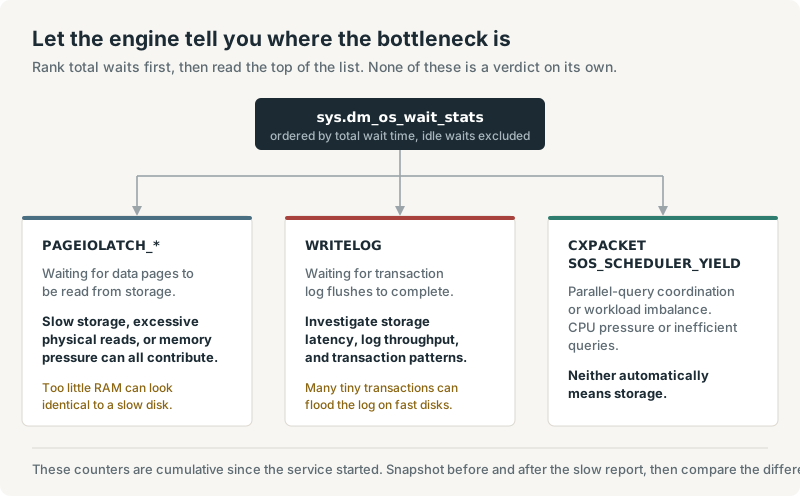
These values are cumulative since the SQL Server service started or the statistics were last cleared. Take a snapshot before and after the slow report and compare the difference, rather than reading a single result in isolation.
Microsoft recommends investigating when average PAGEIOLATCH wait times remain consistently above 10 milliseconds. See the note under Latch wait types in Microsoft's latch contention guidance. Note that most of that article covers PAGELATCH contention, which is a different problem.
2. Measure Latency Per Database File
SELECT
    DB_NAME(vfs.database_id) AS database_name,
    mf.name AS logical_file_name,
    mf.type_desc,
    mf.physical_name,
    vfs.num_of_reads,
    CAST(
        vfs.io_stall_read_ms * 1.0 /
        NULLIF(vfs.num_of_reads, 0)
        AS decimal(12,2)
    ) AS avg_read_ms,
    vfs.num_of_writes,
    CAST(
        vfs.io_stall_write_ms * 1.0 /
        NULLIF(vfs.num_of_writes, 0)
        AS decimal(12,2)
    ) AS avg_write_ms
FROM sys.dm_io_virtual_file_stats(NULL, NULL) AS vfs
JOIN sys.master_files AS mf
    ON vfs.database_id = mf.database_id
   AND vfs.file_id = mf.file_id
ORDER BY avg_read_ms DESC;
As a practical starting point:
- Below 10 ms is generally healthy
- Between 10 and 20 ms deserves investigation
- Consistently above 20 ms is a concern
- Transaction log writes should ideally remain below 5 ms
These are operational guidelines, not universal limits. The correct target depends on the workload, storage design, concurrency, and business response-time requirements.
3. Review Missing Index Recommendations
Run this inside the affected database:
SELECT TOP (20)
    DB_NAME(mid.database_id) AS database_name,
    OBJECT_SCHEMA_NAME(
        mid.object_id,
        mid.database_id
    ) AS schema_name,
    OBJECT_NAME(
        mid.object_id,
        mid.database_id
    ) AS table_name,
    migs.user_seeks,
    migs.user_scans,
    CAST(
        migs.avg_user_impact
        AS decimal(6,2)
    ) AS avg_user_impact_percent,
    mid.equality_columns,
    mid.inequality_columns,
    mid.included_columns
FROM sys.dm_db_missing_index_group_stats AS migs
JOIN sys.dm_db_missing_index_groups AS mig
    ON migs.group_handle = mig.index_group_handle
JOIN sys.dm_db_missing_index_details AS mid
    ON mig.index_handle = mid.index_handle
WHERE mid.database_id = DB_ID()
ORDER BY
    migs.avg_total_user_cost
    * migs.avg_user_impact
    * (migs.user_seeks + migs.user_scans) DESC;
Treat these results as recommendations, not instructions. Before creating an index, compare it with existing indexes, check whether suggestions can be combined, and consider the additional storage and write overhead.
Microsoft specifically warns that missing-index suggestions are estimates and should not be implemented blindly. See Microsoft's missing-index guidance.
4. Do Not Blame Storage Without Checking Memory
High PAGEIOLATCH waits can point to slow storage, but they can also appear when SQL Server does not have enough memory to retain frequently accessed pages.
A RAM-starved server repeatedly removes pages from the buffer pool and reads them from storage again. From the query's perspective, this can look almost identical to a slow disk.
Check memory pressure, buffer cache behavior, query execution plans, and physical read volume before concluding that storage is the root cause.
The Real Lesson
Slow systems are rarely caused by one thing.
Storage, database size, indexing, query design, maintenance, resource allocation, and application architecture can all contribute to the same visible symptom. Replacing the most obvious component may improve performance, but it can also hide the actual root causes.
Hardware upgrades have their place. Sometimes they are absolutely necessary. But hardware should support a properly maintained system, not compensate indefinitely for poor data management and missing database maintenance.
If you suspect something in your environment is not performing as it should, do not wait until the problem becomes normal. Have the full system assessed by someone who will measure the evidence, challenge the assumptions, and find the actual cause.
Sometimes the most expensive IT problem is not the fault itself. It is the explanation everyone stopped questioning.
